The latest Realist update includes customization for Community Insights, improved descriptions clarifying data, enhanced News widget selections, bug fixes, and more.
Community Insights #
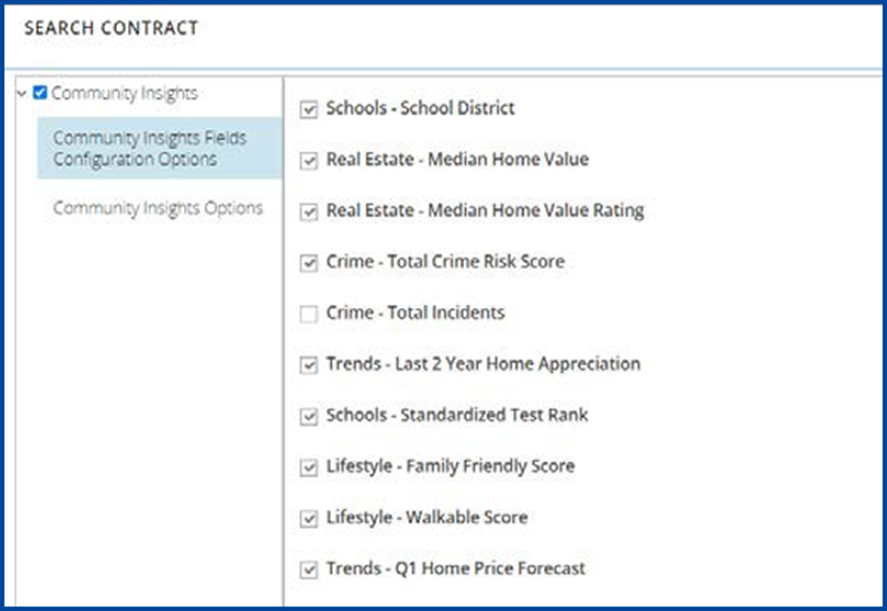
You can now enable or disable each of the 10 data points in the Community Insights section, tailoring the information to your and your client’s needs. Data points available for customization include:
- Real Estate – Median Home Value
- Real Estate – Median Home Value Rating
- Crime – Total Crime Risk Score
- Crime – Total Incidents
- Schools – School District
- Schools – Standardized Test Rank
- Lifestyle – Family Friendly Score
- Lifestyle – Walkable Score
- Trends – Q1 Home Price Forecast
- Trends – Last 2 Year Home Appreciation
Updated Quick Stats Text #
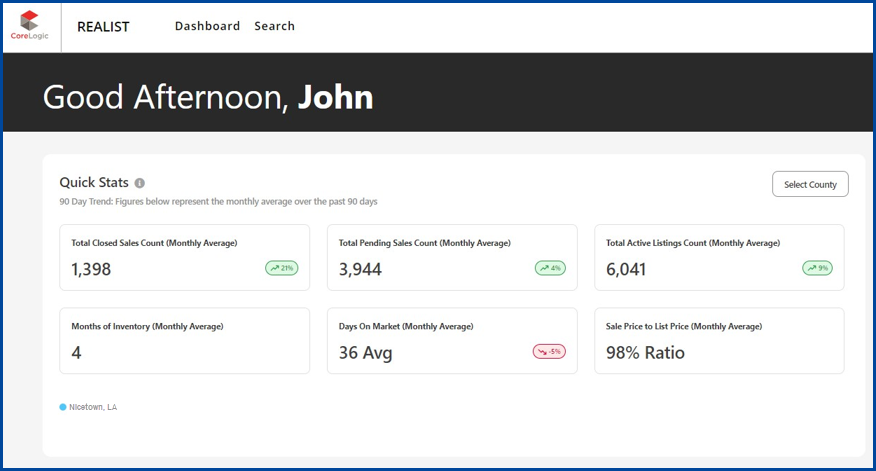
The Quick Stats data points for both the ListingTrends and MarketTrends attributes on the dashboard now include improved descriptions of the data points, helping users understand and interpret the data for better decisions. The descriptions also reinforce that the Quick Stats are monthly averages.
For Counties with ListingTrends Data (using REAS ListingTrends Data):
| Total Closed Sales Count | Total Closed Sales Count (Monthly Average) |
| Total Pending Sales | Total Pending Sales Count (Monthly Average) |
| Total Active Listings Count | Total Active Listings Count (Monthly Average) |
| Months of Inventory | Updated to Months of Inventory (Monthly Average) |
| Days on Market | Days on Market (Monthly Average) |
| Sale Price to List Price | Sale Price to List Price (Monthly Average) |
| 90 Day Trend | 90 Day Trend: Figures below represent the monthly average over the past 90 days |
For Counties with MarketTrends Only Data (using REAS MarketTrends Data):
Old New
| Total Closed Sales (Tax) | Total Closed Sales Count (Tax – Monthly Average) |
| Total Closed New Construction Sales (Tax) | Total Closed New Construction Sales Count (Tax – Monthly Average) |
| Total Closed Re-Sales Count (Tax) | Total Closed Re-Sales (Tax – Monthly Average) |
| Average New Construction Sales Price (Tax) | Average New Construction Sales Price (Tax – Monthly Average) |
| Average Re-Sales Price (Tax) | Average Re-Sales Price (Tax – Monthly Average) |
| Average Sales Price per SqFt (Tax) | Average Sales Price per SqFt (Tax – Monthly Average) |
| 90 Day Trend | 90 Day Trend: Figures below represent the monthly average over the past 90 days |
Market Trends Report & Insights Dashboard Enhancements – Estimated Average Sale Price #
To improve accuracy, we’ve updated how sale prices are displayed in non-disclosure states. This update ensures that all references to average sale prices in these states are clearly labeled as “Estimated.” On the Market Trends report, this appears in the “tax” section to say Estimated Average Sale Price, and on the Insights Dashboard, this appears as Estimated Average Sale Price (Tax).
Using MarketTrends Data on the Insights Dashboard #
Realist now uses MarketTrends attributes only for counties where listing data is not available. Agents will continue to see ListingTrends attributes unless those are unavailable for the selected county, in which case Realist will show MarketTrends data. When users make a selection that includes both counties without listing data and counties with listing data, Realist will default to showing MarketTrends for all selected counties.
This update ensures that the correct dataset is used to provide the most accurate and relevant market insights.
When a user hovers their cursor over the MarketTrends, this help text will appear:
Data based on CoreLogic’s REAS MarketTrends. Stay informed with data updates up to [Latest Data Period Available for MarketTrends], ensuring you have access to the most current market trends.
When analyzing multiple counties, we provide a comprehensive overview by aggregating the “Total Closed Sales,” “Total Closed New Construction Sales,” and “Total Closed Re-Sales Count” for a collective insight. Results are taken over a period of 90 days vs the previous 90 days to provide a 90-day trend. Moreover, to offer a balanced perspective, we calculate the “Average New Construction Sales Price,” “Average Re-Sale Price,” and “Average Sale Price per SqFt” as an average across all selected counties, delivering a nuanced understanding of the market dynamics at play.
When a user hovers their cursor over the ListingTrends, this help text will appear:
Data based on CoreLogic’s REAS ListingTrends. Stay informed with data updates up to [Latest Data Period Available for ListingTrends], ensuring you have access to the most current market trends.
When analyzing multiple counties, we provide a comprehensive overview by aggregating the “Total Closed Sales,” “Total Pending Sales,” and “Total Active Listings” for a collective insight. Results are taken over a period of 90 days vs the previous 90 days to provide a 90-day trend. Moreover, to offer a balanced perspective, we calculate the “Months of Inventory,” “Days on Market,” and “Sale Price to List Price” as an average across all selected counties, delivering a nuanced understanding of the market dynamics at play.
Insights Dashboard: News Widget Enhancement #
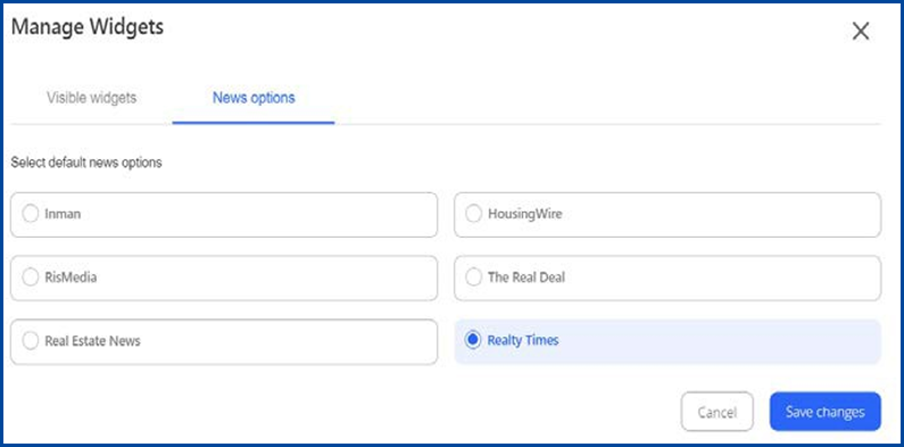
The News widget on the Realist Insights Dashboard now allows users to select and save their preferred news source (your options may be determined by your brokerage and may look different from the example below).
News Source Options: #
- Inman: Inman News
- HousingWire: HousingWire
- RISMedia: RISMedia
- The Real Deal: The Real Deal
- Real Estate News: Real Estate News
- Realty Times: Realty Times
Bug Fixes #
- We have increased the size of the property suggestion window so that users can see the full address, including unit numbers.
- Previously, when users clicked the Realist Property Detail link from Matrix on a new construction listing where the parcel record could not be found, a wall of text appeared. This has been fixed so that a “No Properties Found” dialog screen now displays when the parcel record cannot be found.
- Generated Order Confirmation emails now have the proper images and updated text to provide a clear and helpful confirmation message to users.


